Our team has struggled a lot with logging over the years. Where do you store them, how do you sort through them, how do you make sure you funnel them off your system so that you can persist them but don't have to worry about filling up the system's memory.
Well it's time for me to sing the praises of Grafana and Loki. Grafana was originally made for monitoring hardware metrics, but with the release of Loki several years ago, its capabilities now extend to a deep analysis of logging.
Problem Statement
We have many docker-compose projects running many different services each and all of their logs get piped via docker logs by default to json files.
Not so easy to deal with.
We need logging that is persistent, easily sortable, searchable and classifiable. We don't want to worry about it, and we want it to be reusable for every different environment.
Solution + Implementation
Grafana makes an open source software called Loki that works with its flagship Grafana software to make persisting and querying logs trivial.
Loki acts as the brain and can process logs from many different inputs such as Promtail, Docker, Grafana Alloy etc (in this example we will just focus on Docker). Loki will process these logs, chunk them and store them in memory for some time and then back them up to S3 for us. Loki will also field queries written in LogQL.
Grafana is the frontend. It is use-able even by non-technical people. It facilitates the creation of dashboards and visualizations all based on logs. It allows for three basic functions, querying, transforming, and visualizing data. There are many tutorials online for this, so this post won't focus on that.
Loki's one caveat is that it is somewhat sparsely documented. Some of the information in the docs is outdated and can easily lead developers down rabbit holes that won't work. However, once it works, it's glorious.
In this example, we'll set up Loki and Grafana docker containers within the same docker network as everything else. We will pipe all docker logs output straight to Loki and then visualize
Setting up Loki/Grafana
To get Loki/Grafana running, we'll use a docker-compose file as well as the templated config file for loki, and a shell script to fill in the templated config.
docker-compose.yml
This launches two services loki and grafana and configures them properly, including creating the loki config from the template.
version: '3.8'
services:
  loki:
    image: grafana/loki:latest
    ports:
      - "3100:3100"
    volumes:
      - ./loki-config-TEMPLATE.yml:/etc/loki/loki-config-TEMPLATE.yml
      - ./generate-loki-config.sh:/etc/loki/generate-config.sh  # Mount the script
    user: root  # Switch to root user temporarily
    entrypoint:
      - /bin/sh
      - -c
      - |
        apk add --no-cache gettext && \
        chmod +x /etc/loki/generate-config.sh
        /etc/loki/generate-config.sh
        /usr/bin/loki -config.file=/etc/loki/loki-config.yml  # Run Loki with the generated config file
    restart: always
    env_file:
      - .env  # Add this line to specify the .env file for environment variables
    networks:
      - nginx-reverse-proxy_proxy
  grafana:
    environment:
      - GF_PATHS_PROVISIONING=/etc/grafana/provisioning
      - GF_AUTH_ANONYMOUS_ENABLED=false
    entrypoint:
      - sh
      - -euc
      - |
        mkdir -p /etc/grafana/provisioning/datasources
        cat <<EOF > /etc/grafana/provisioning/datasources/ds.yaml
        apiVersion: 1
        datasources:
        - name: Loki
          type: loki
          access: proxy
          orgId: 1
          url: http://loki:3100
          basicAuth: false
          isDefault: true
          version: 1
          editable: false
        EOF
        /run.sh
    image: grafana/grafana:latest
    ports:
      - "3000:3000"
    restart: always
    volumes:
      - grafana_data:/var/lib/grafana  # Add this line to map a named volume for Grafana's data storage
    networks:
      - nginx-reverse-proxy_proxy
networks:
  nginx-reverse-proxy_proxy:
    driver: bridge
    external: true

volumes:
  grafana_data:  # Declare the new named volume for Grafana
generate-loki-config.sh
This just creates the loki-config by substituting any environmental variables into the file such as keys etc.
#!/bin/sh
envsubst < /etc/loki/loki-config-TEMPLATE.yml > /etc/loki/loki-config.yml
loki-config-TEMPLATE.yml
In this config template, the loki service is configured to upload periodically to S3 to persist the logs data.
auth_enabled: false

limits_config:
  allow_structured_metadata: true
  volume_enabled: true

server:
  http_listen_port: 3100
  grpc_listen_port: 9096

common:
  path_prefix: /tmp/loki
  storage:
    s3:
      endpoint: s3.amazonaws.com
      bucketnames: "loki"
      region: us-east-1
      access_key_id: ${your_key_here}
      secret_access_key: ${your_secret_key_here}
  replication_factor: 1
  ring:
    instance_addr: 127.0.0.1
    kvstore:
      store: inmemory

schema_config:
  configs:
    - from: 2020-07-01
      store: tsdb
      object_store: aws
      schema: v13
      index:
        prefix: index_
        period: 24h

ingester:
  lifecycler:
    ring:
      kvstore:
        store: inmemory
      replication_factor: 1
Setting up Docker Daemon + Loki Plugin
First install the Loki plugin for docker:
docker plugin install grafana/loki-docker-driver:2.9.2 --alias loki --grant-all-permissions
Once this is complete, Docker needs to be told to use this plugin for logs:
On Linux and Mac, in /etc/Docker/daemon.json and add the following to the json file, or create it if it does not yet exist. The full daemon.json might look like this:
{
  "debug": true,
  "log-driver": "loki",
  "log-opts": {
    "loki-batch-size": "400",
    "loki-url": "http://localhost:3100/loki/api/v1/push"
  }
}
Finally restart the Docker Daemon
Check out Grafana
Now that everything is setup, you can navigate to http://localhost:3100 and login to Grafana with the default login: admin/admin
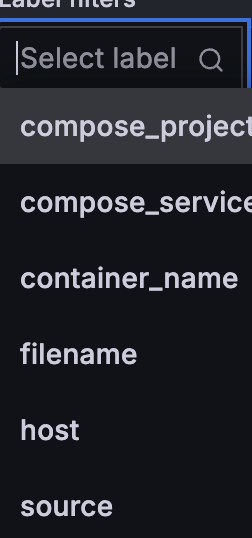
If you go to the explore tab, you will already see that the logs have been categorized by the docker tags, like this:

You can make a query in the top right and run it or even using WebSockets, you can watch lives come in live from Loki (be sure to make sure WebSockets is enabled if using a Reverse Proxy!)
There's a lot more to do with this. You can funnel system logs into Grafana as well as logs from really just about anywhere and have it all queryable. PM's on your team can make Dashboards as well and diagnose issues without having to contact the tech team depending on the problem
Overall, Grafana is incredibly powerful, and once Loki is running, it's a total game changer.
